Assess Regression Predictions on Held-Out Pairs
regression_plot.RdAssesses regression predictions on evaluation pairs of truth and
prediction, held out from fitting the calibrator, such as an assessment set
or a test set. Unlike plot.venn_abers_regression, which shows
the stored state of a fit, this graphic needs new truth values.
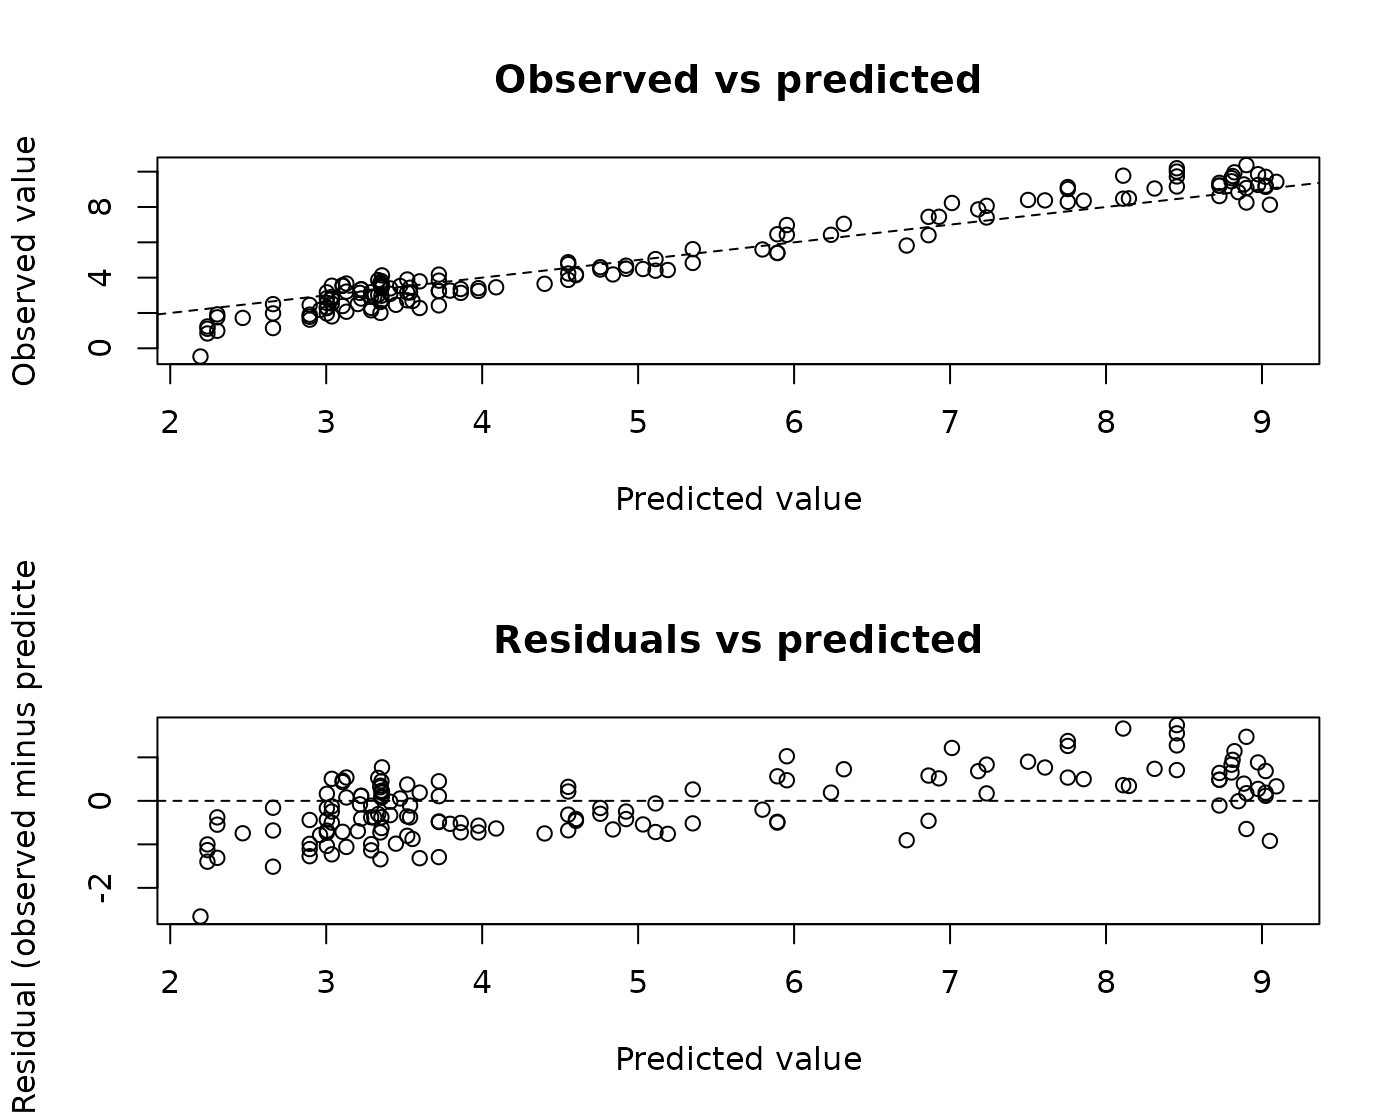
which = "observed" draws the observed against the predicted values
with the dashed diagonal of equality, titled "Observed vs
predicted". which = "residual" draws the residuals, observed minus
predicted, against the predicted values with a dashed horizontal line at
zero, titled "Residuals vs predicted".
Arguments
- truth
A non-empty numeric vector of finite observed values.
- prediction
A numeric vector of finite predicted values, the same length as
truth, such as thepredictioncolumn ofpredict.venn_abers_regression.- which
One or more distinct values of
"observed"(default) and"residual": the diagrams to draw.- ...
Base R graphical options passed to
plot(), taking precedence over the defaults in every panel.
Value
Invisibly, a data frame with one row per pair in input order and the
columns prediction, truth, and residual
(truth - prediction), the same whatever which holds.
Details
The pairs are drawn as points, without a smoother. Choosing both diagrams draws them in this order, one above the other over the same predictions, in their own grid, and restores the previous graphical parameters on exit, also after errors.
Invalid pairs are errors; there is no na.rm. The graphic describes
the evaluation pairs given and makes no statement about the Venn-Abers
regression bounds lower and upper, which it does not use.
See also
venn_abers_regression for regression calibrators,
plot.venn_abers_regression for their fit diagnoses, and
corp_plot and calibration_plot for held-out
classification probabilities.
vignette("diagnostics", package = "vennabers") compares both kinds of
graphics.
Examples
set.seed(1)
score <- runif(300, 0, 10)
truth <- score + sin(score) + rnorm(300, sd = .5)
fitting <- 1:150
calibrator <- venn_abers_regression(truth[fitting], score[fitting])
assessment <- predict(calibrator, score[-fitting])$prediction

regression_plot(truth[-fitting], assessment)
regression_plot(truth[-fitting], assessment, which = c("observed", "residual"))