Assess Calibration with CORP Reliability Diagrams
corp_plot.RdAssesses the calibration of probabilities on evaluation pairs of truth and
probability, held out from fitting the calibrator, such as an assessment
set or a test set. Unlike plot.venn_abers, which shows the
stored state of a fit, these graphics need new truth values.
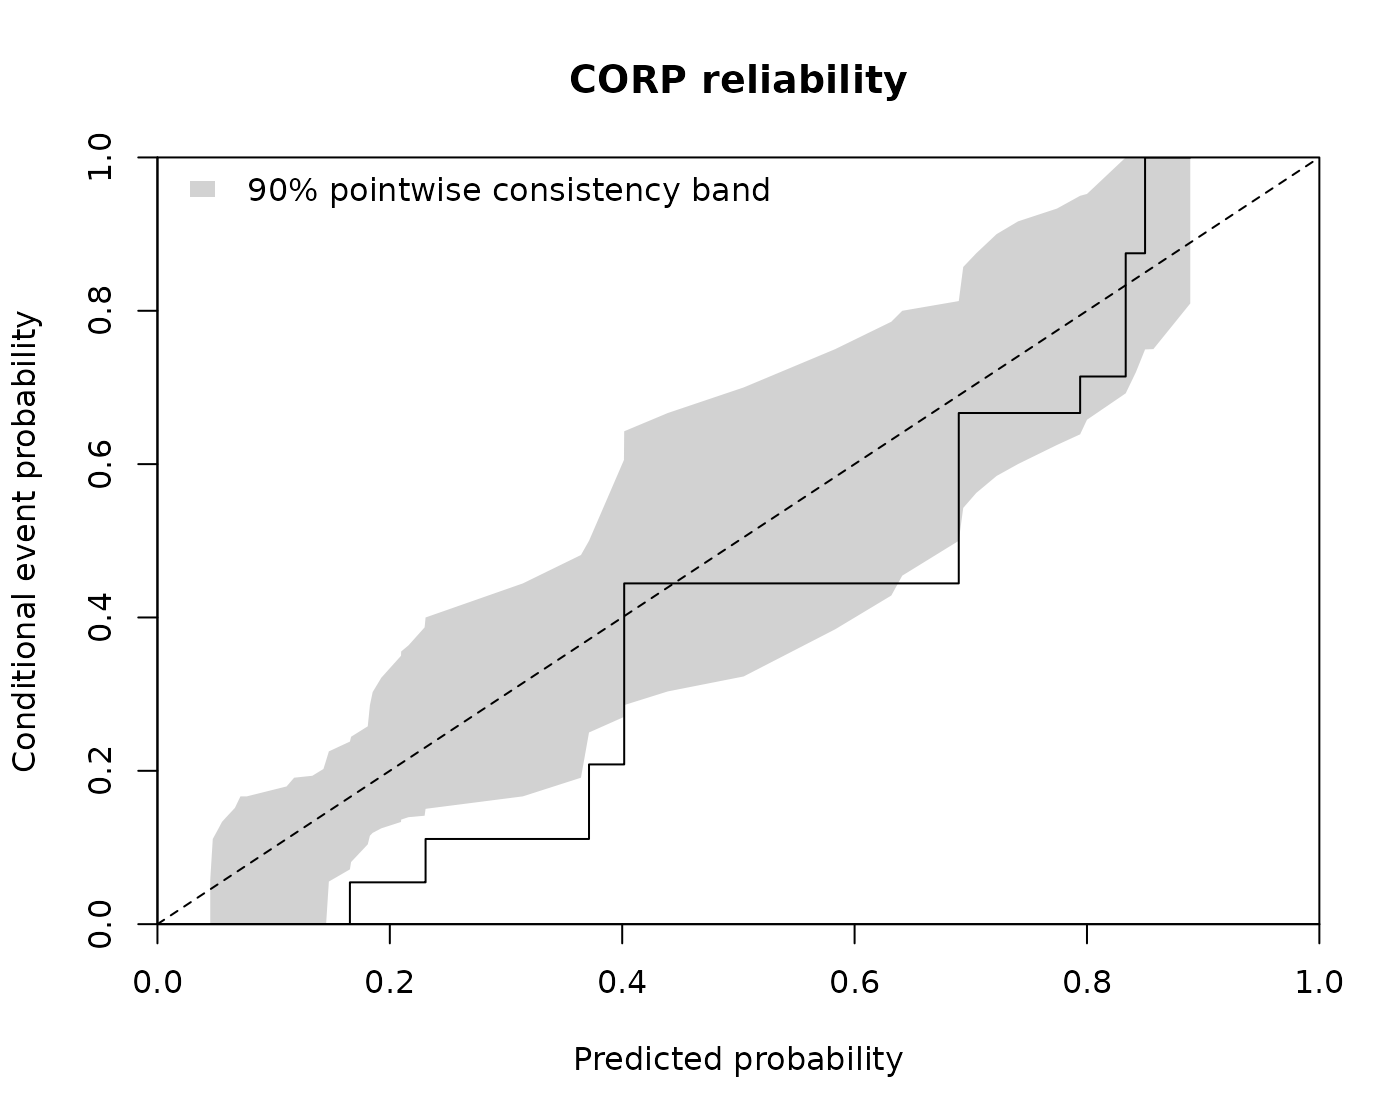
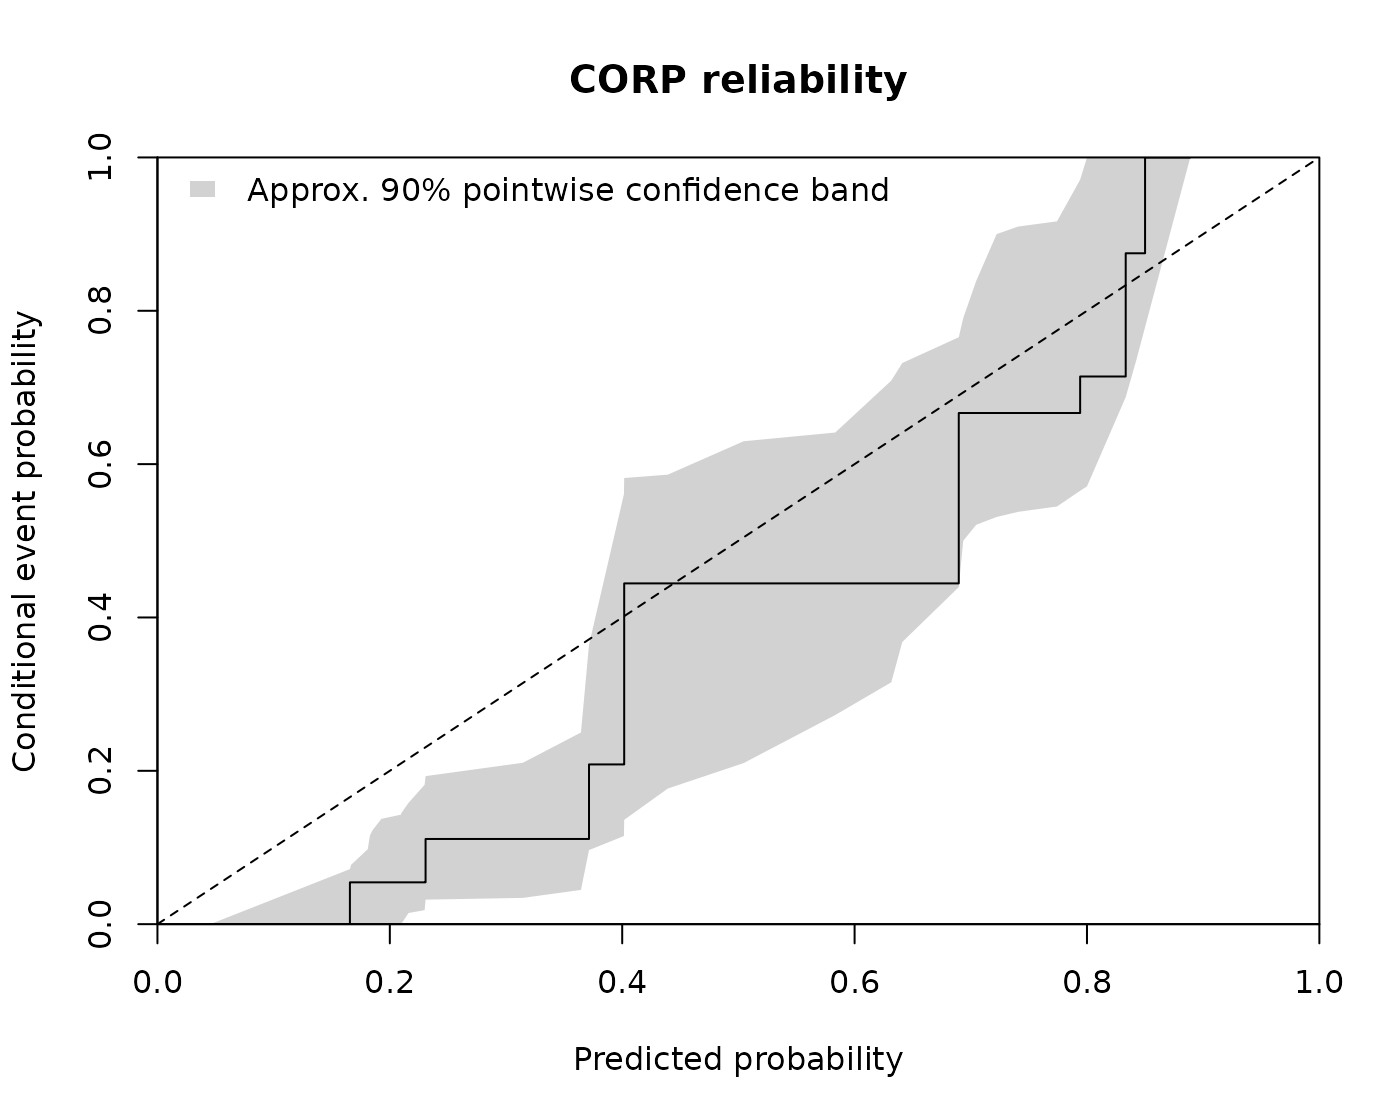
corp_plot() draws the CORP reliability diagram of Dimitriadis,
Gneiting and Jordan (2021): the CORP estimate of the conditional event
probability as a step over the probabilities, from the smallest to the
largest, against the dashed diagonal of perfect calibration on
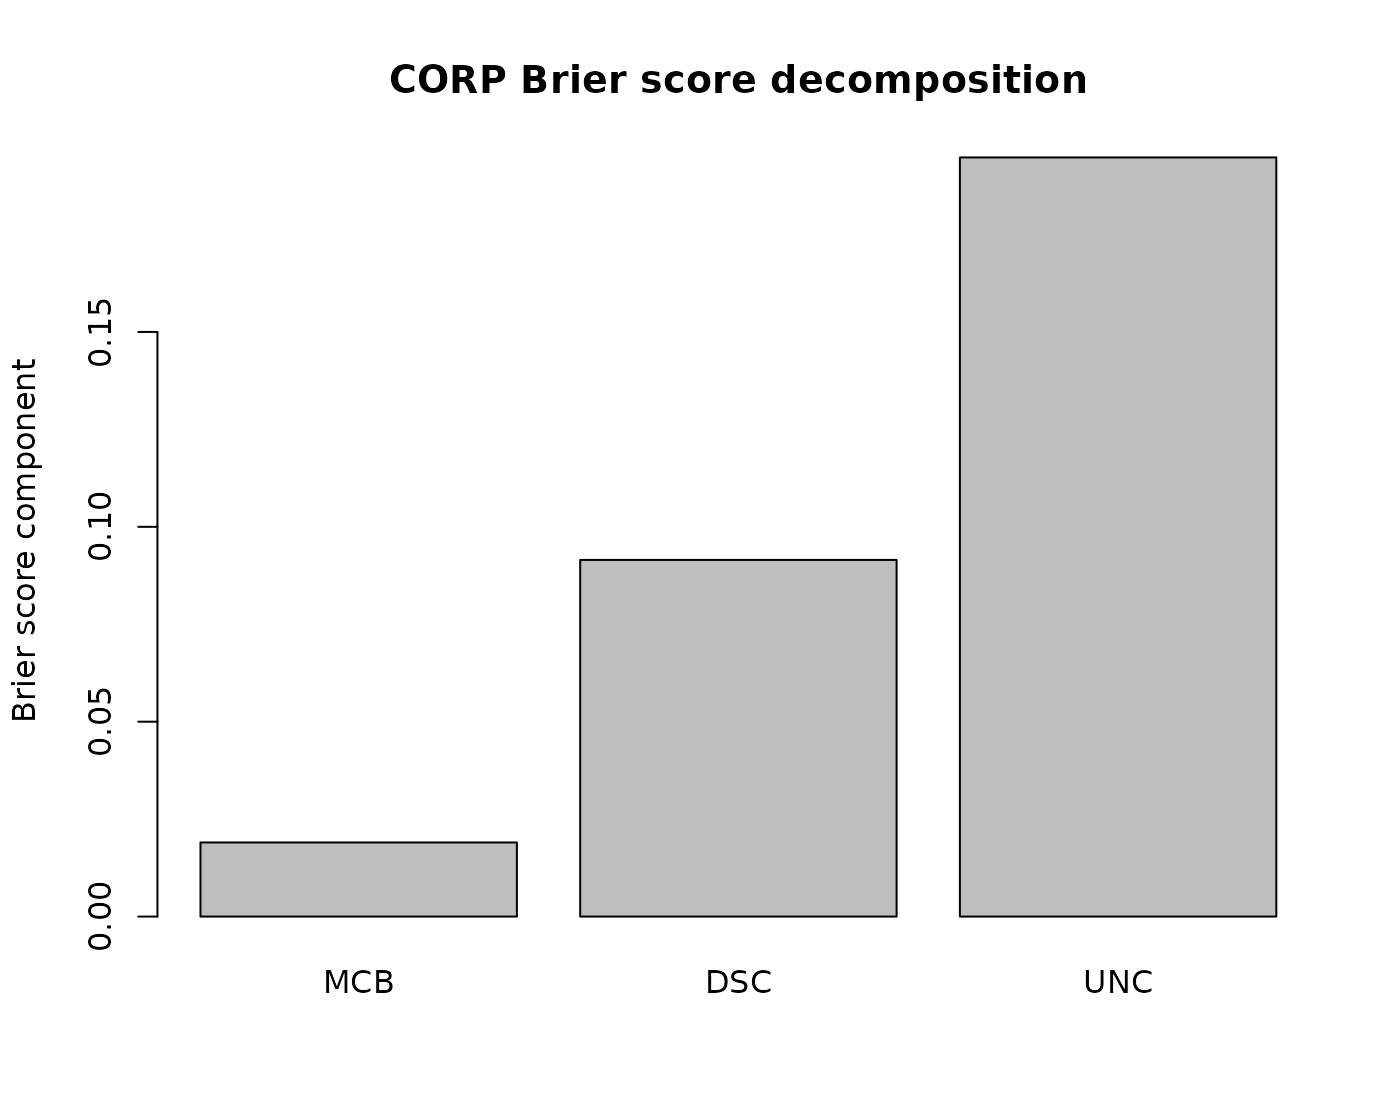
[0, 1]. corp_decomposition_plot() draws the CORP decomposition
of the Brier score as bars of miscalibration (MCB), discrimination (DSC),
and uncertainty (UNC).
Usage
corp_plot(truth, probability, band = "consistency", level = 0.9,
          replicates = 1000, seed = NULL, ...)

corp_decomposition_plot(truth, probability, ...)
Arguments
- truth
A non-empty logical or numeric vector containing only
FALSE/0andTRUE/1.TRUE/1is the event class. Alternatively factor truth under the scoring contract inbrier_score; assessment may omit observations of some levels.- probability
A numeric vector of regularized event probabilities, the same length as
truth, with finite values in[0, 1]. For factor truth, the final class matrix under the input contract ofvenn_abers, never the internal pair probabilities.- band
Exactly one of
"consistency"(default),"confidence", or"none": the uncertainty band drawn with the CORP estimate: the pointwise consistency band around the diagonal, the approximate pointwise confidence band around the estimate, or none. See the section on uncertainty bands.- level
One number strictly between 0 and 1: the pointwise level of the band.
- replicates
One finite whole number of at least 1: the resampling replicates of the band.
replicates * (1 - level) / 2must be at least 1, so that each band quantile has a replicate beyond it.- seed
NULLor one integer in R's seed range for the band replicates. With a seed, the band is reproducible and the caller's random state is left unchanged; without one, the band draws from and advances the global random stream.- ...
Base R graphical options passed to
plot()incorp_plot()and tobarplot()incorp_decomposition_plot(), taking precedence over the defaults in every panel.
Value
corp_plot() returns invisibly a data frame with one row per unique
probability in increasing order and the same columns whatever band
holds: probability, estimate (the CORP estimate of the
conditional event probability), count (the pairs with this
probability), band_lower and band_upper (the band limits),
valid_replicates (the replicates defined at this probability, which
the limits rest on), and the
controls band, level, replicates, and seed, the
same in every row. Without a band, band_lower, band_upper,
and valid_replicates are NA, as they are when the confidence
band is omitted; without a seed, seed is
NA. The band limits are named apart from the Venn-Abers values
lower and upper, which they are not.
corp_decomposition_plot() returns invisibly a data frame with one row
and the columns brier, mcb, dsc, and unc.
For factor truth, both add a leading factor column class with the
truth levels, grouping rows by class order.
Details
The CORP estimate is the isotonic (PAV) regression of the events on the
probabilities, computed with isoreg. Equal
probabilities are valid and pooled, so they share one estimate, and the
estimate never decreases. Unlike the bins of calibration_plot,
it needs no tuning.
With the PAV estimate q and the event rate r on the same pairs,
mcb is the Brier score of the probabilities minus that of q,
dsc the Brier score of r minus that of q, and
unc the Brier score of r, so that
brier = mcb - dsc + unc up to rounding. Lower mcb and higher
dsc are better; unc depends on the truth only.
The decomposition is deterministic.
Pairs are assumed independent. Both graphics describe the evaluation pairs given, conditional on the fitted calibrator; they make no statement about Venn-Abers validity.
Uncertainty bands
Both bands are computed by resampling as in the reliabilitydiag
package (version 0.2.1). Each of the replicates draws the pairs with
replacement, draws new events from the drawn probabilities themselves
(consistency band) or from the CORP estimate at them (confidence band), fits
PAV again with ties pooled, and interpolates that fit linearly at the unique
probabilities, leaving it missing outside the drawn range. The band limits
at each probability are the (1 - level) / 2 and
(1 + level) / 2 quantiles of its valid replicates
(quantile, type 7), so they lie in [0, 1] and
equal probabilities share them. The band is drawn as a translucent gray area
with a legend naming it; the limits are linearly interpolated between the
unique probabilities.
The consistency band shows where the CORP estimate of a perfectly
calibrated forecast with these probabilities would fall; an estimate outside
it points to miscalibration there. It is a reference region, not a test of
Venn-Abers validity. The confidence band resamples from the estimate itself
and is only approximate: the bootstrap of an isotonic fit is not consistent
for continuous probabilities, so the band claims no nominal coverage. It
fares better with few distinct probabilities and many pairs at each, as
Venn-Abers calibrators often produce. In a simulation study at level 0.9
with 1000 replicates, 1000 runs, and true conditional event probability
x^2, its mean pointwise coverage at probabilities between 0.05 and
0.95 was 0.92 for 100 and 0.88 for 1000 uniform probabilities, and 0.95 and
0.91 for 100 and 1000 pairs on ten distinct probabilities. It varied along
the curve, down to 0.34 just above 0.05 for 1000 uniform probabilities. The
consistency band held the CORP estimate of calibrated probabilities with
mean coverage between 0.90 and 0.93 in the same settings. At inner
probabilities with an estimate of exactly 0 or 1, the confidence limits are
interpolated linearly from the neighboring probabilities, a heuristic of
the reference; at the
smallest and largest probabilities the band stays narrow there. When the
pairs (for factor truth, of a class) hold only one outcome, the confidence
band is omitted with a warning and its limits are NA; the consistency
band depends on the probabilities only and is always computed.
Both bands are pointwise at level for each probability, not
simultaneous over the curve, and for factor truth they are computed class by
class without joint coverage across classes. They assume independent pairs;
dependent data such as time series or clusters need other methods. Small
assessment sets give wide bands that say little. The band limits are not
Venn-Abers lower and upper probabilities.
The cost grows with replicates times the number of pairs, each
replicate sorting and fitting them again. The exact quantiles hold the
replicate values at every unique probability in memory at once, a matrix of
unique probabilities by replicates. With the default 1000 replicates and
100000 continuous probabilities, that matrix takes about 800 MB and the
call about 2 GB at its peak, and one call takes minutes, the confidence band
several times longer than the consistency band. Few distinct probabilities
need far less. For large assessment sets, band = "none" skips the
resampling.
Multiclass
Every factor, even with two levels, is evaluated class by class: each class
against the rest, using its final probability. corp_plot() draws one
panel per class, titled "CORP: <class>", in its own nearly square grid
as in calibration_plot, and restores the previous graphical
parameters on exit, also after errors. Its bands draw the replicates of the
classes in turn from one random stream, set once by seed.
corp_decomposition_plot()
draws one panel of the components grouped side by side, one bar and legend
entry per class, without a combined value.
Each brier is the binary Brier score of its class,
mean((y_k - p_k)^2). Their sum over classes is the multiclass value of
brier_score, which they do not replace.
References
Dimitriadis, T., Gneiting, T. and Jordan, A. I. (2021). Stable reliability diagrams for probabilistic classifiers. Proceedings of the National Academy of Sciences, 118(8), e2016191118. doi:10.1073/pnas.2016191118
See also
calibration_plot for binned reliability diagrams,
brier_score for scores, regression_plot for
held-out regression predictions, and plot.venn_abers for
fit diagnoses. vignette("diagnostics", package = "vennabers") compares
both kinds of graphics.
Examples
set.seed(1)
score <- runif(400)
truth <- rbinom(400, 1, score^2)
fitting <- 1:200
calibrator <- venn_abers(truth[fitting], score[fitting])
assessment <- predict(calibrator, score[-fitting])$probability
corp_plot(truth[-fitting], assessment, seed = 1)
 corp_plot(truth[-fitting], assessment, band = "confidence", replicates = 199, seed = 1)
 corp_decomposition_plot(truth[-fitting], assessment)