Plot Classification Probability Calibration
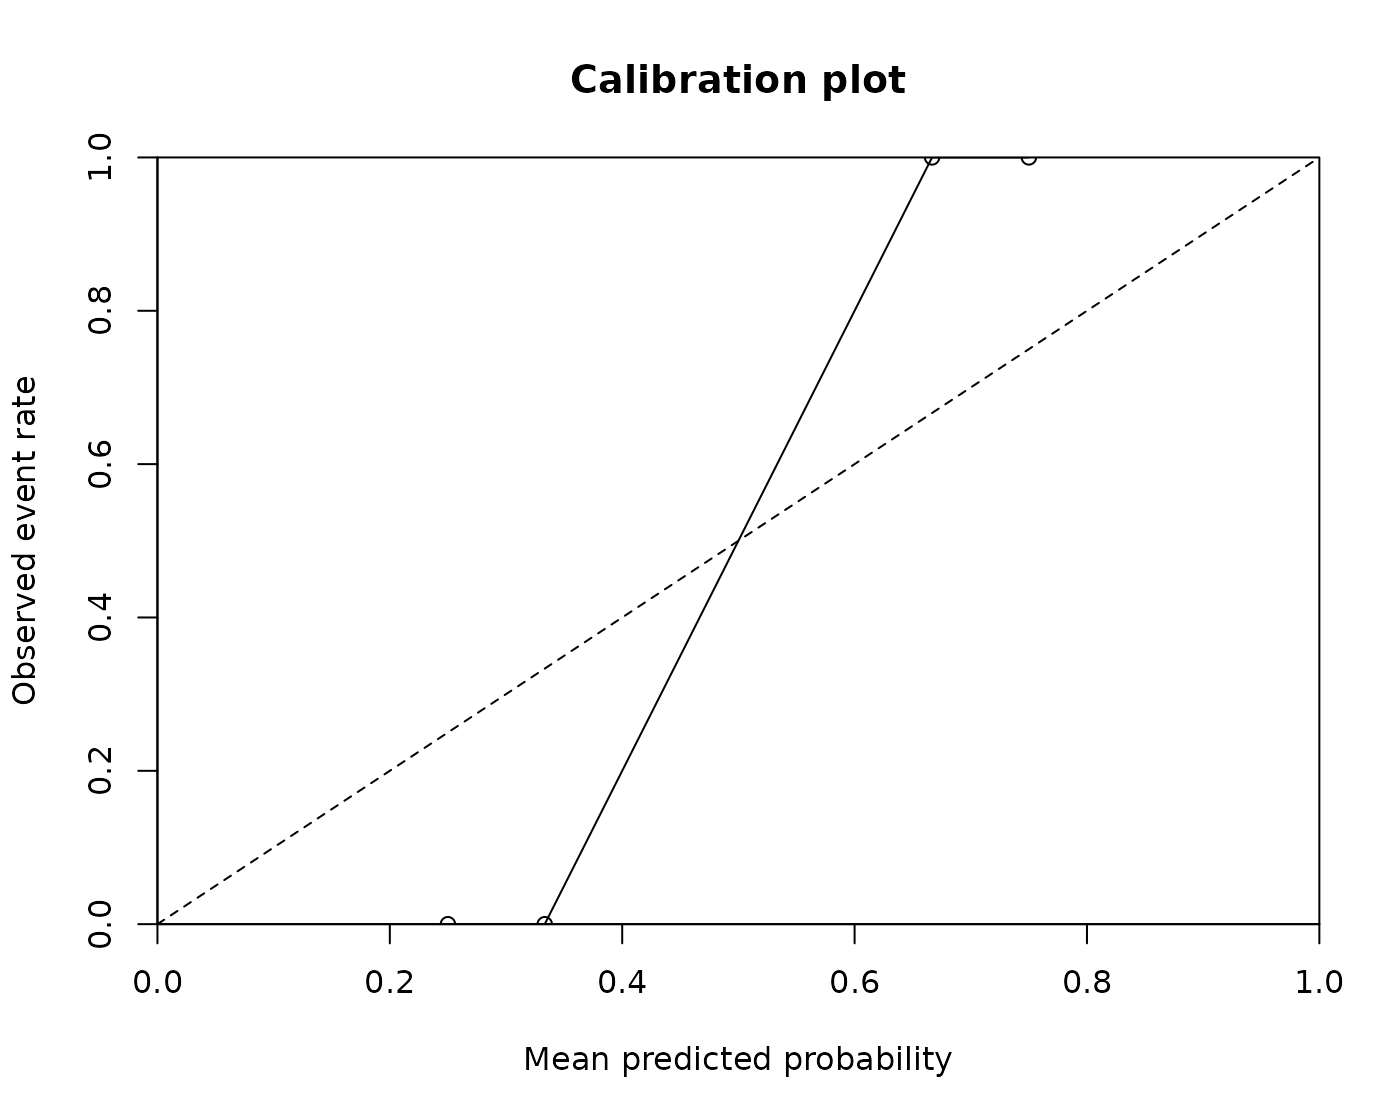
calibration_plot.RdDraws a dependency-free reliability diagram of mean regularized probability against observed event rate. Multiclass draws one panel per class in a rectangular layout and restores the previous graphical parameters on exit. Graphical options apply to every panel; by default its title identifies the class. Bins are equal-width, left-closed and right-open, except that the last bin includes one.
Arguments
- truth
A non-empty logical or numeric vector containing only
FALSE/0andTRUE/1.TRUE/1is the event class. Alternatively, factor truth under the scoring contract inbrier_score; assessment may omit observations of some levels.- probability
A numeric vector of regularized event probabilities, the same length as
truth, with finite values in[0, 1]. For factor truth, the final class matrix under the input contract ofvenn_abers, never the internal pair probabilities.- bins
One finite whole number of equal-width bins.
- ...
Base R graphical options passed to
plot().
Value
Invisibly, a data frame with columns mean_probability,
event_rate, and count for each non-empty bin.
Multiclass adds a leading factor column class with the truth levels,
grouping rows by class order and then increasing bin order. Each class is
evaluated against the rest using its final probability. Empty bins are omitted.
See also
corp_plot for CORP reliability diagrams without bins and with
uncertainty bands, regression_plot for held-out regression
predictions, and plot.venn_abers for fit diagnoses of the
stored calibration map. vignette("diagnostics", package = "vennabers")
compares both kinds of graphics.
Examples
truth <- c(FALSE, TRUE, FALSE, TRUE)
uncalibrated_probability <- c(0.1, 0.4, 0.35, 0.8)
calibrator <- venn_abers(truth, uncalibrated_probability)
prediction <- predict(calibrator, uncalibrated_probability)

calibration_plot(truth, prediction$probability)