Plot the Calibration Map of a Fitted Venn-Abers Calibrator
plot.venn_abers.RdDraws a fit diagnosis from the stored state of a fitted calibrator, without
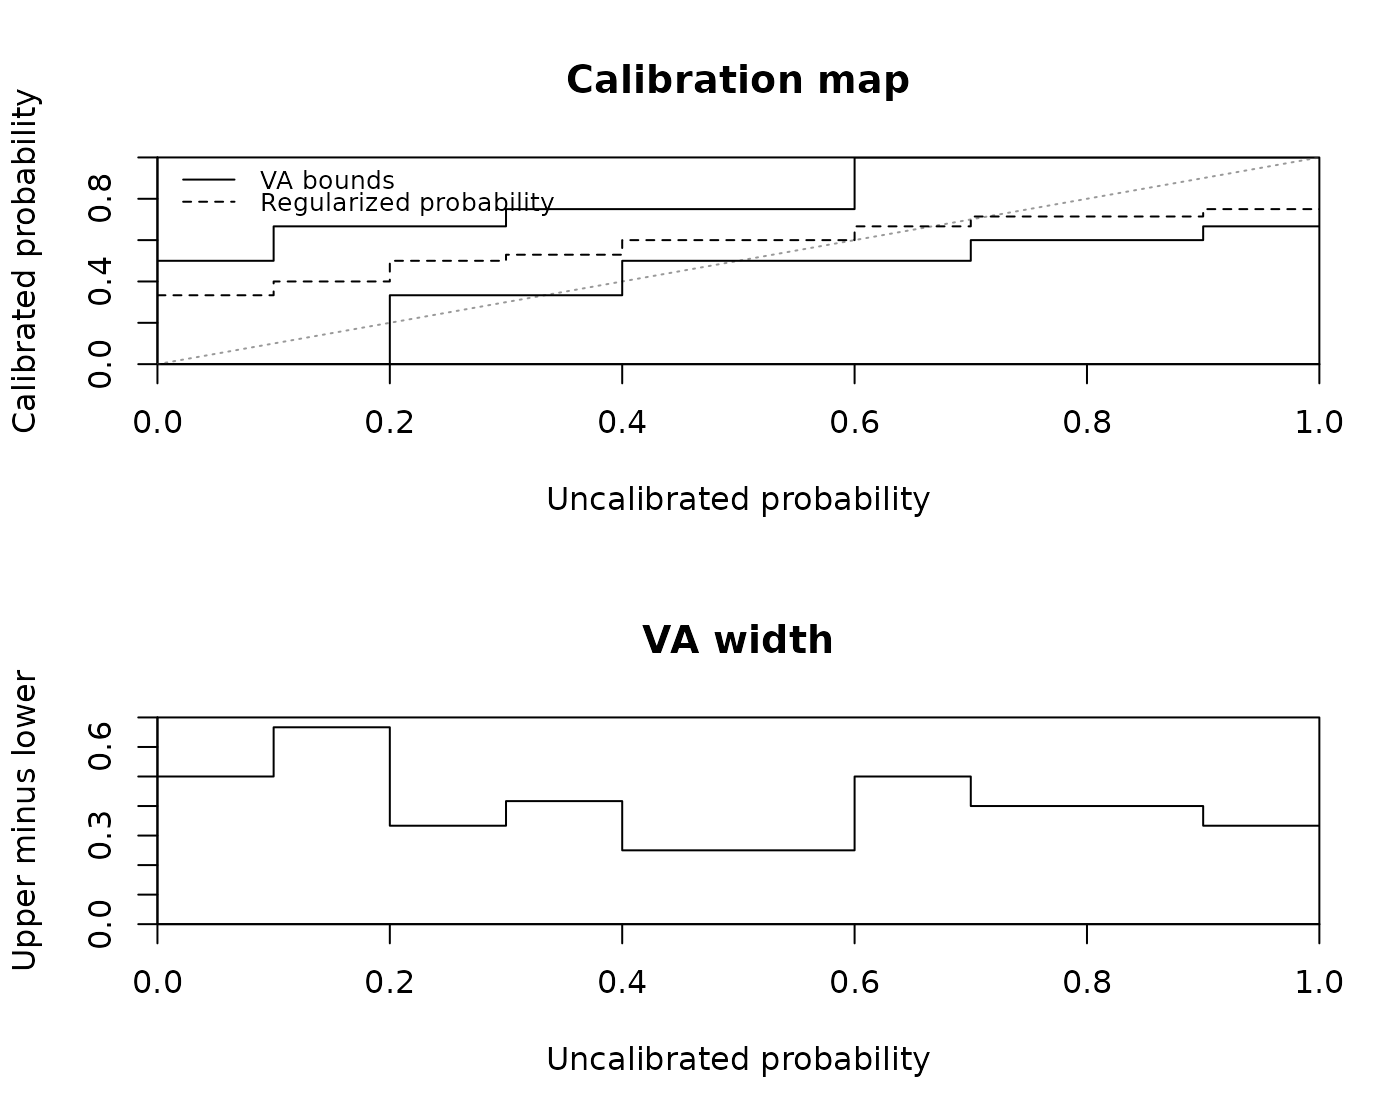
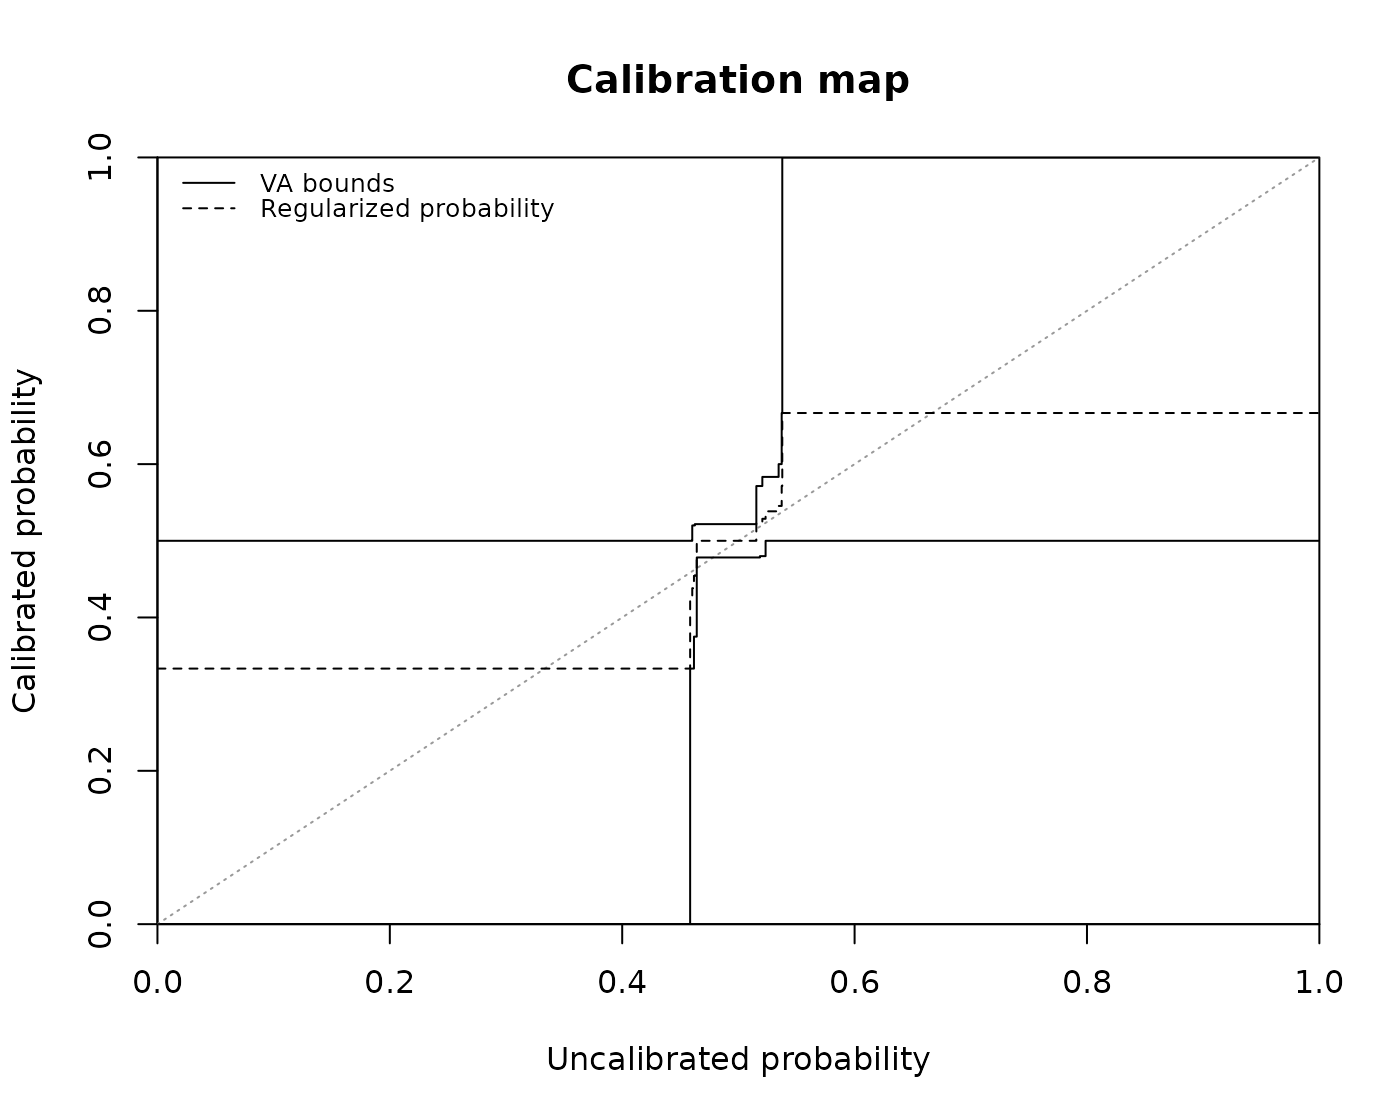
new truth values. For classification, the calibration map shows the lower
and upper Venn-Abers values as steps and the regularized probability as a
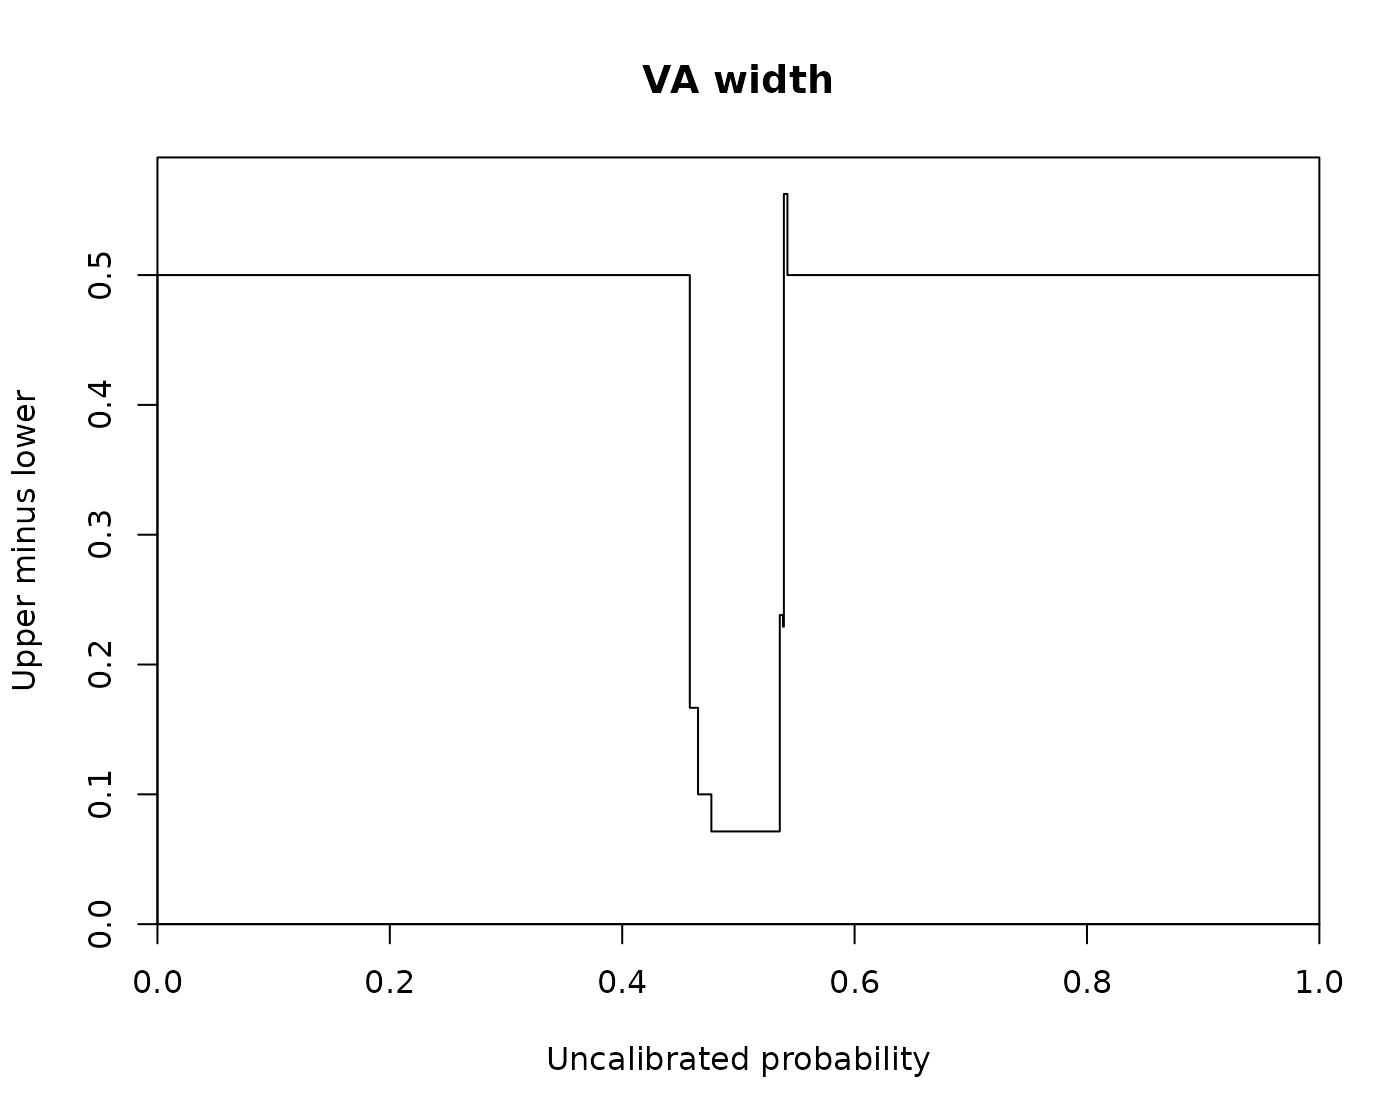
dashed line over the uncalibrated probability on [0, 1]. The width diagram shows
upper - lower over the same scores; it is neither a confidence level
nor a nominal coverage.
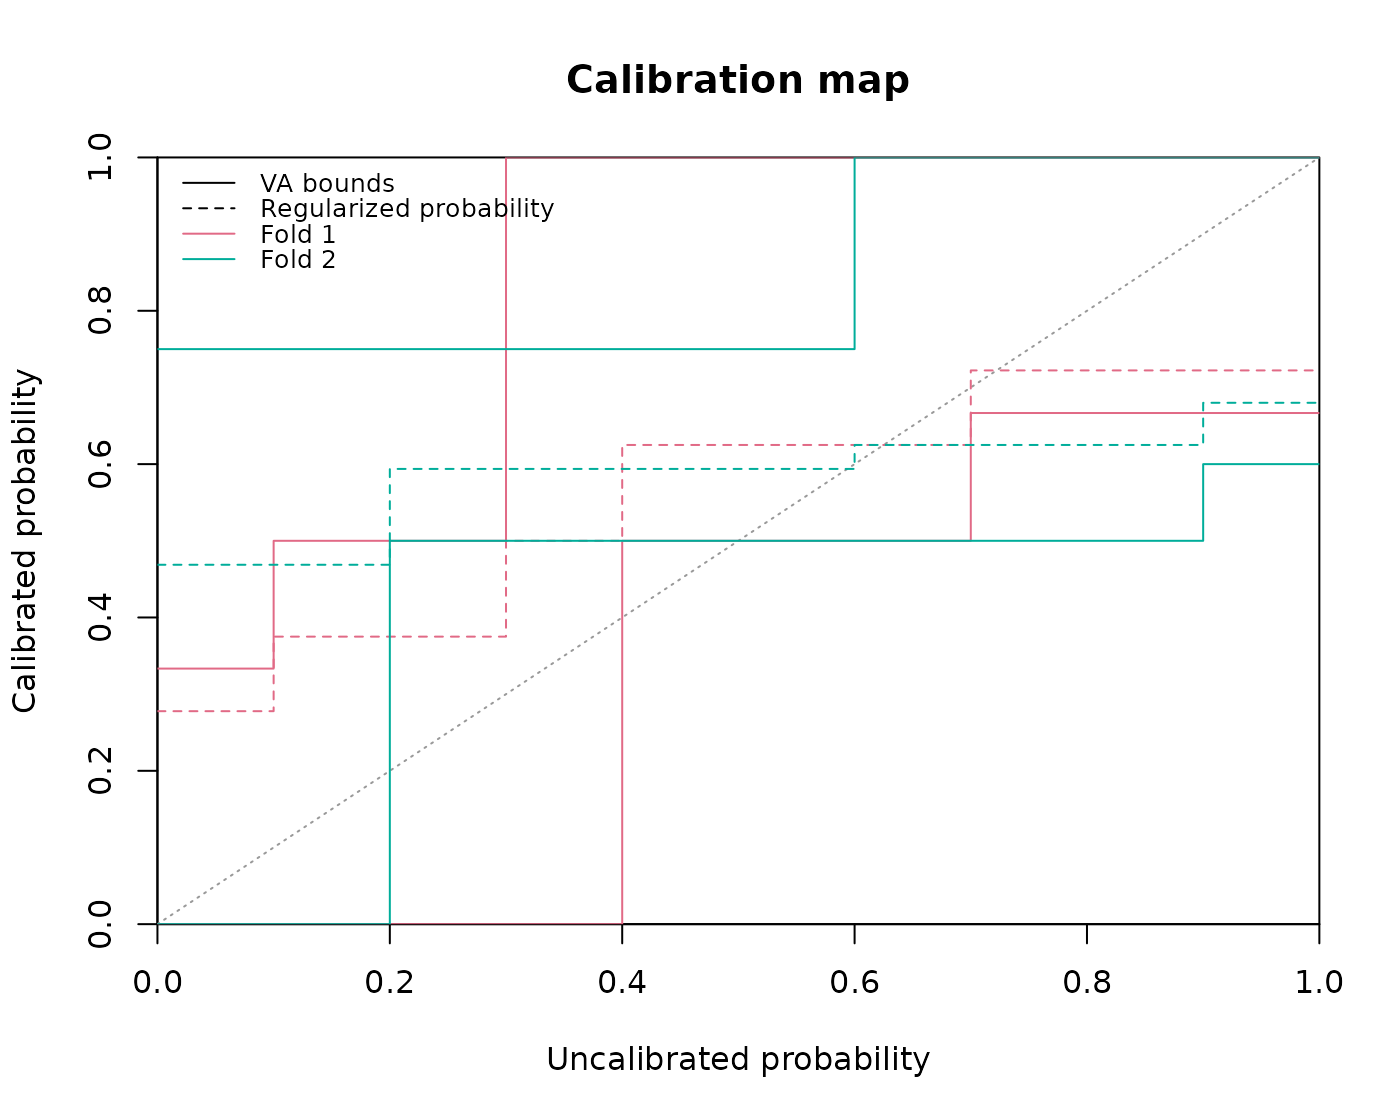
Cross fits overlay the map of every fold calibrator in one panel, distinguished by color and legend. Comparing fold maps at common scores does not describe the spread of an individual Cross prediction.
Choosing both diagrams draws them in their own grid of panels and restores
the previous graphical parameters on exit, also after errors. A single
diagram uses the current layout. Fits without a stored calibration map
(knots, lower, upper) are errors; refit them with
vennabers 1.0.0.
Usage
# S3 method for class 'venn_abers'
plot(x, which = "map", loss = "log", ...)

# S3 method for class 'cross_venn_abers'
plot(x, which = "map", loss = "log", ...)

# S3 method for class 'venn_abers_regression'
plot(x, which = "map", ...)

# S3 method for class 'cross_venn_abers_regression'
plot(x, which = "map", ...)

# S3 method for class 'vennabers_fit'
plot(x, which = "map", loss = x$loss, ...)
Arguments
- x
A fitted binary or multiclass
venn_abersorcross_venn_abersobject, or a fittedvenn_abers_regressionorcross_venn_abers_regressionobject. Forplot.vennabers_fit, a frozen fit fromcalibrate_workflowor the engine fit of a trainedcalibrated_workflow, extracted withworkflows::extract_fit_engine(); see the Workflows section.- which
A character vector of distinct diagrams from
"map"(default), the calibration map, and"width", the Venn-Abers widthupper - lower. Both draw the map before the width, whatever their order.- loss
Exactly
"log"(default) or"brier": the regularization of the drawn and returned probability, as inpredict.venn_abers. Classification only: regression methods take noloss, and passing one is an error. For a workflow fit, the default is thelossstored at fitting.- ...
Base R graphical options passed to
plot(), taking precedence over the defaults in every panel. For regression,xlimalso sets the range of the returned table.
Value
Invisibly, a data frame with the same columns whatever which holds:
score, lower, upper, probability, and
width. Rows hold each stored probability knot plus the range ends 0
and 1 in increasing order. Values are those of predict() at
score with the chosen loss, and width is
upper - lower.
For cross_venn_abers, a leading character column fold holds the
stored fold IDs. Rows group by fold in stored order, each with its own knots
and the values of its own fold calibrator, not the aggregated Cross
probability.
For multiclass fits, the tables of all subproblems are stacked in stored
order, with identity columns named as in venn_abers_details
after fold and before the values: class for one-vs-rest,
class_1 and class_2 for one-vs-one. Within a Cross
subproblem, folds follow the stored fold IDs of the fit.
For regression, the columns are score, lower, upper,
prediction, and width, after fold for
cross_venn_abers_regression, with the values of predict() at
score. The range ends replace 0 and 1; see the Regression section.
For a workflow fit, the table is that of its stored Venn-Abers calibrator.
A pairwise fit stacks the tables of its pair components in stored order,
led by the identity columns pair_id, then fold for Cross
fits, then class_1 and class_2, as in
venn_abers_details.
Between neighboring rows, the map holds the lower value of the left
row and the upper value of the right row, so the width between knots
exceeds the width at them. The drawn curves follow these values exactly.
Multiclass
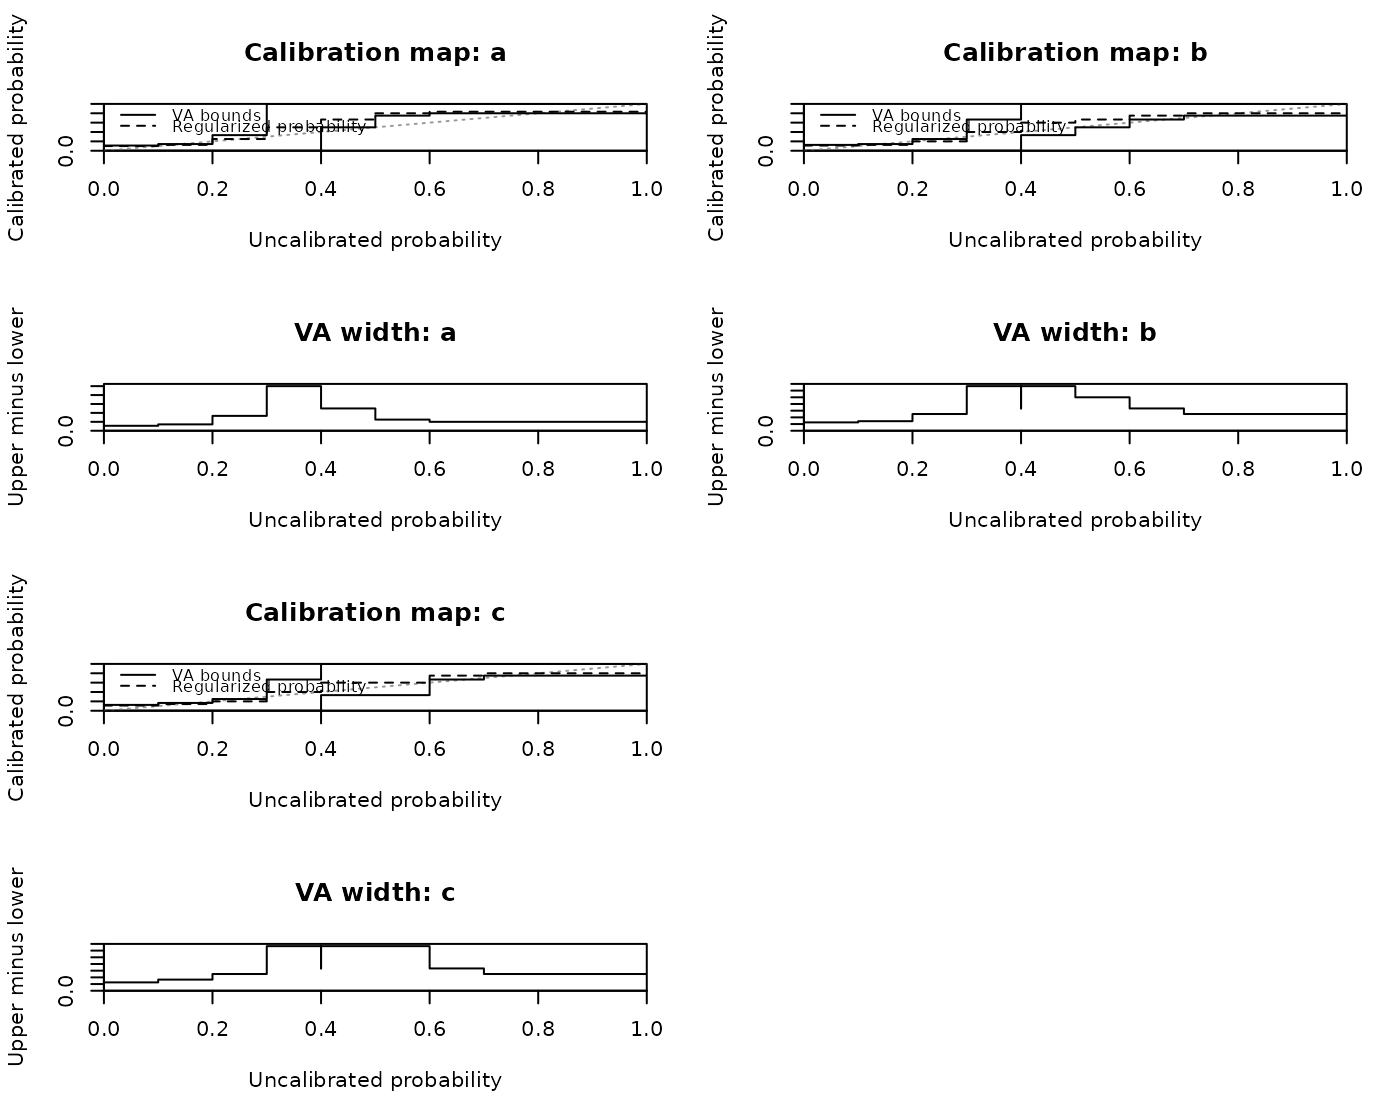
A multiclass fit draws one panel per subproblem and diagram, titled
"Calibration map: <class>" for one-vs-rest and
"Calibration map: <class_1> vs <class_2>" for one-vs-one (likewise
"VA width"). Each panel shows the map of the subproblem's own binary
calibrator over its score: the probability of the class for one-vs-rest, and
the probability of class_2 renormalized within the pair for
one-vs-one. The final coupling into class probabilities is not drawn. Cross
fits overlay the fold maps of each subproblem in its panel, each fold in the
same color across panels.
The panels fill their own grid row by row, nearly square as in
calibration_plot. With both diagrams, each row of maps is
followed by the widths of the same subproblems. A single panel, as for one
one-vs-one pair, uses the current layout. Options in ... apply to
every panel.
Regression
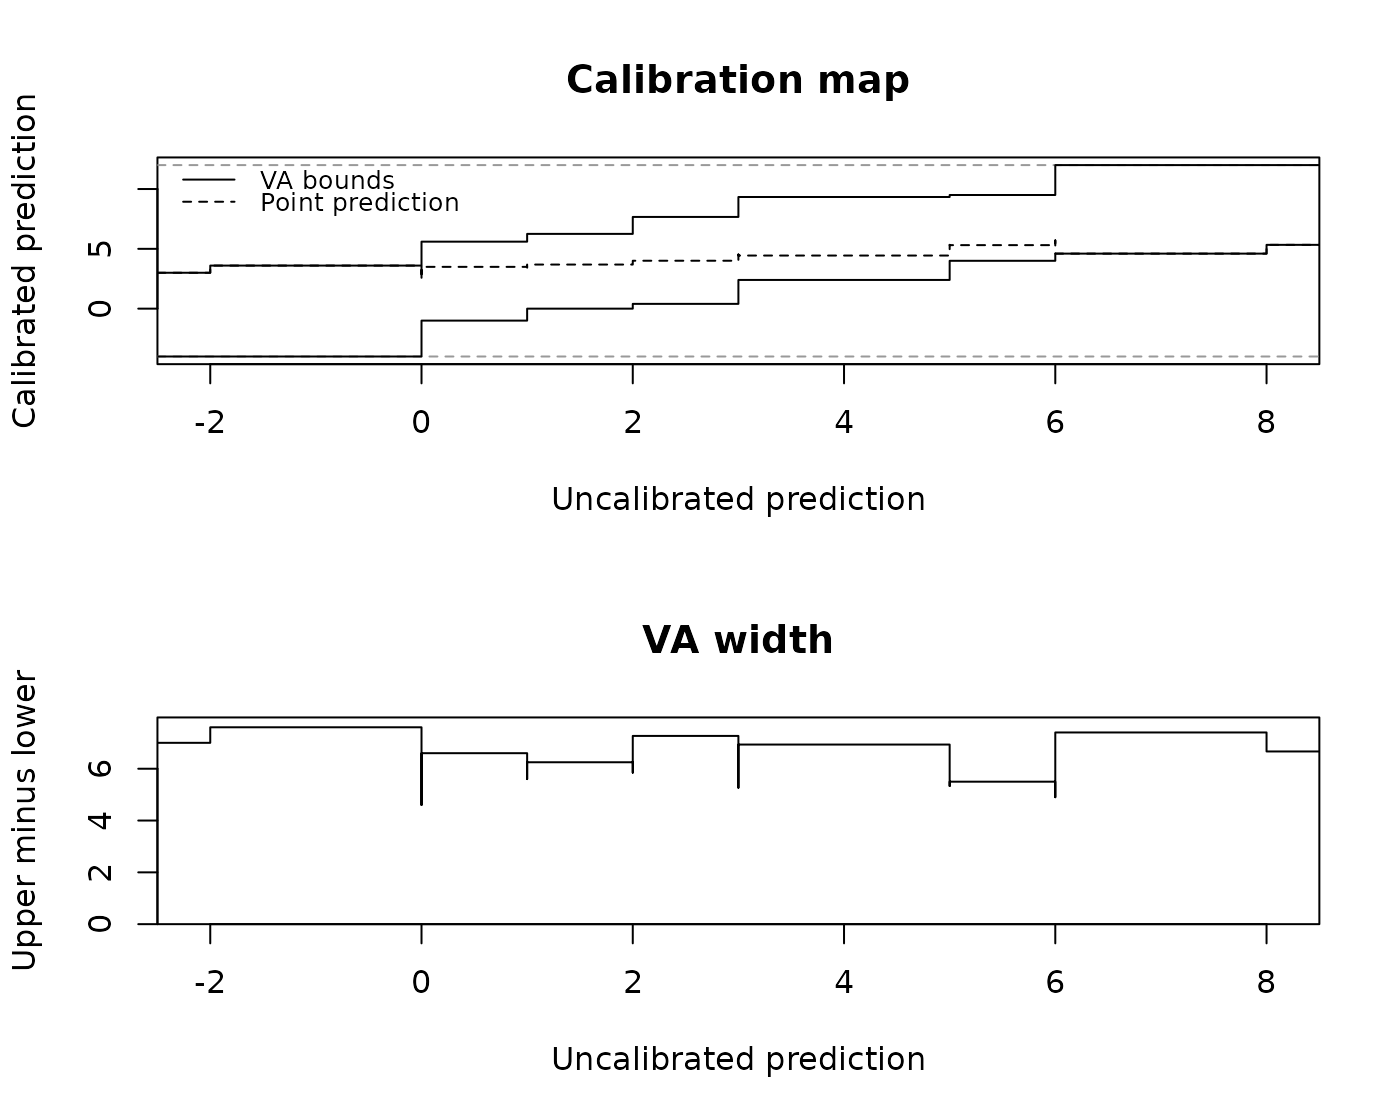
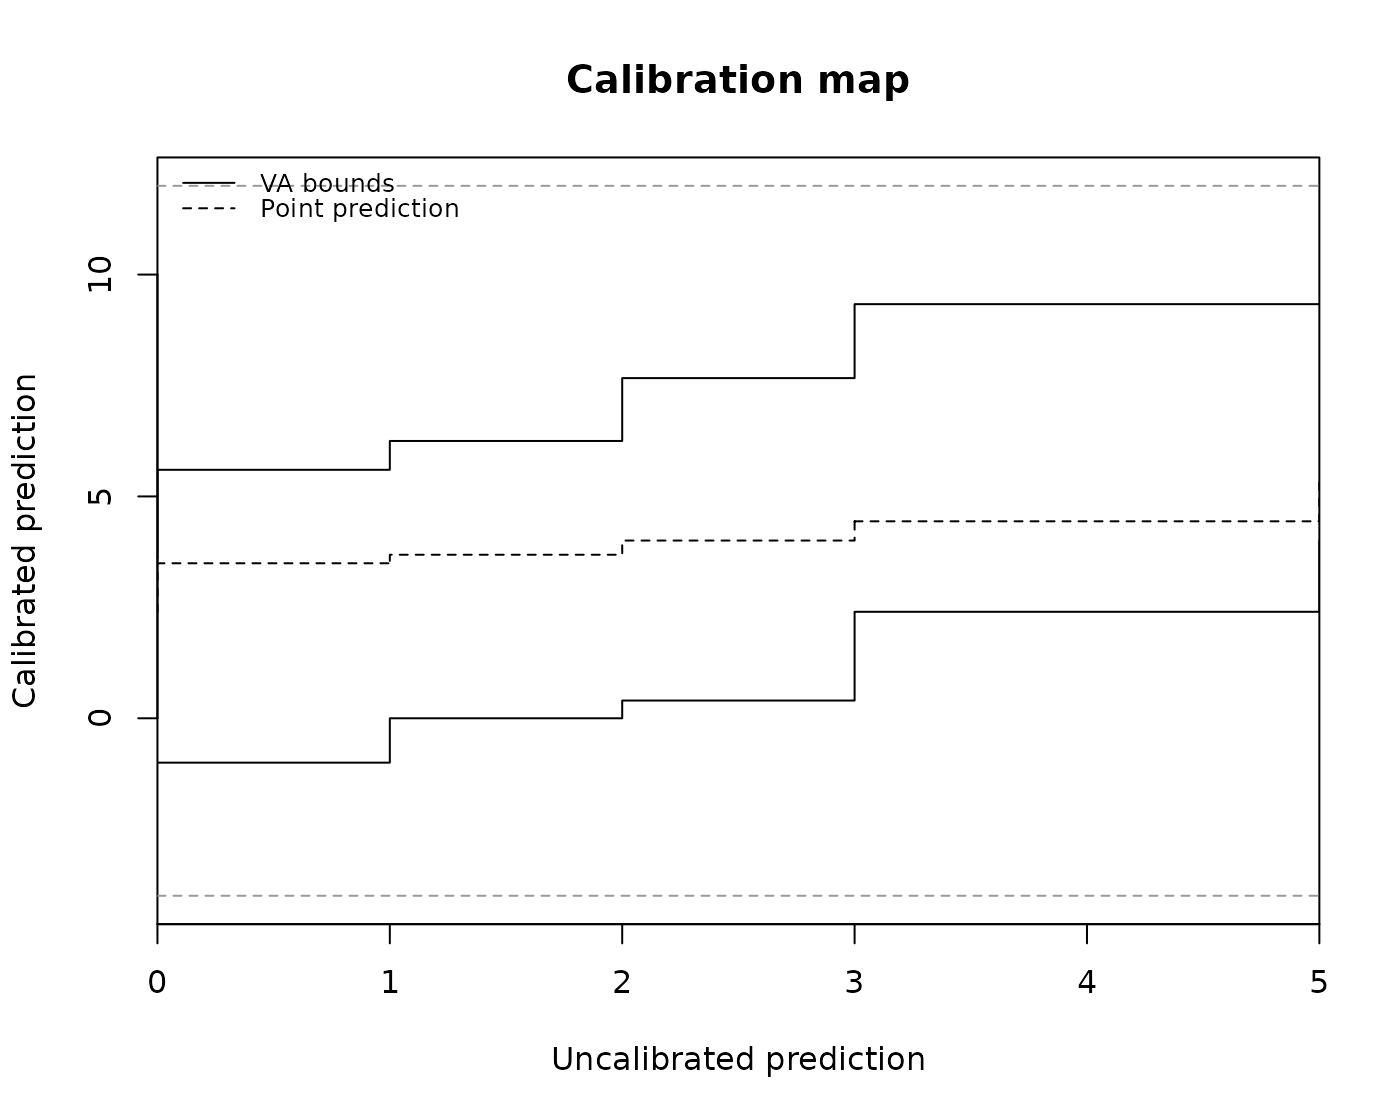
A regression fit draws the lower and upper Venn-Abers values as steps and the
point prediction as a dashed line over the uncalibrated prediction, with
gray dashed reference lines at the moderated truth values a and
b that bound every Venn-Abers value. The width diagram shows
upper - lower in units of the outcome.
The drawn range spans the stored knots, widened on each side by 5 % of
their span; a single knot widens by 5 % of its absolute value, or 0.05 at
zero. A Cross fit spans the knots of all folds, overlays its fold maps with
a reference line at each fold's a and b, and returns every
fold map over this shared range. A finite xlim in ...
replaces the range: the table then holds its ends and the knots within.
Workflows
plot() on a frozen fit from calibrate_workflow, and on
workflows::extract_fit_engine(fit) for a trained
calibrated_workflow, draws the fit diagnosis of the stored
Venn-Abers calibrator: binary, multiclass, or regression, inductive or
Cross, as described above for that calibrator, with the same table. There is
no method for the workflow itself. Postprocessing models (sigmoid, tailor,
isotonic, or their ensembles) are source models before the calibrator: the
map shows the calibrator over their output, not the postprocessing step.
A pairwise fit (model_training = "pairwise") draws one panel per pair
component and diagram, titled "Calibration map: <class_1> vs <class_2>",
in a grid as for multiclass fits. Each panel shows the binary calibrator of
its pair over the probability of class_2 from that pair's own model.
A fit without a stored Venn-Abers calibrator is an error.
See also
Assessment graphics need held-out truth values instead of the stored state:
corp_plot and calibration_plot for
classification probabilities, regression_plot for regression
predictions. vignette("diagnostics", package = "vennabers") compares
both kinds of graphics.
Examples
truth <- c(FALSE, TRUE, FALSE, TRUE, TRUE, FALSE, TRUE, TRUE)
uncalibrated_probability <- c(0.1, 0.2, 0.3, 0.4, 0.4, 0.6, 0.7, 0.9)
calibrator <- venn_abers(truth, uncalibrated_probability)
map <- plot(calibrator, which = c("map", "width"))
 head(map)
#> score lower upper probability width
#> 1 0.0 0.0000000 0.5000000 0.3333333 0.5000000
#> 2 0.1 0.0000000 0.5000000 0.3333333 0.5000000
#> 3 0.2 0.3333333 0.6666667 0.5000000 0.3333333
#> 4 0.3 0.3333333 0.6666667 0.5000000 0.3333333
#> 5 0.4 0.5000000 0.7500000 0.6000000 0.2500000
#> 6 0.6 0.5000000 0.7500000 0.6000000 0.2500000
cross <- cross_venn_abers(truth, uncalibrated_probability, fold = rep(1:2, 4))
plot(cross, loss = "brier")
 classes <- c("a", "b", "c")
class_truth <- factor(rep(classes, 4), levels = classes)
class_probability <- prop.table(matrix(c(
6, 3, 1, 2, 5, 3, 1, 2, 7, 5, 1, 4, 3, 4, 3, 2, 2, 6,
4, 4, 2, 1, 6, 3, 3, 3, 4, 5, 3, 2, 2, 7, 1, 2, 2, 6
), 12, 3, byrow = TRUE, dimnames = list(NULL, classes)), 1)
ovr <- venn_abers(class_truth, class_probability, method = "ovr")
head(plot(ovr, which = c("map", "width")))
 #> class score lower upper probability width
#> 1 a 0.0 0.0 0.1111111 0.1000000 0.1111111
#> 2 a 0.1 0.0 0.1111111 0.1000000 0.1111111
#> 3 a 0.2 0.0 0.1428571 0.1250000 0.1428571
#> 4 a 0.2 0.0 0.2500000 0.2000000 0.2500000
#> 5 a 0.3 0.0 0.3333333 0.2500000 0.3333333
#> 6 a 0.4 0.5 1.0000000 0.6666667 0.5000000
outcome <- c(-4, 1, 0, 3, 2, 6, 5, 9, 7, 12)
uncalibrated_prediction <- c(-2, 0, 0, 1, 2, 3, 3, 5, 6, 8)
regression <- venn_abers_regression(outcome, uncalibrated_prediction)
head(plot(regression, which = c("map", "width")))
 #> score lower upper prediction width
#> 1 -2.5 -4.0 3.000000 3.000000 7.000000
#> 2 -2.0 -4.0 3.000000 3.000000 7.000000
#> 3 0.0 -1.0 3.600000 2.389474 4.600000
#> 4 1.0 0.0 5.600000 3.446154 5.600000
#> 5 2.0 0.4 6.250000 3.714039 5.850000
#> 6 3.0 2.4 7.666667 4.526294 5.266667
plot(regression, xlim = c(0, 5))
 if (all(vapply(c("parsnip", "workflows", "hardhat", "rsample", "recipes",
"rlang", "tibble", "withr", "generics", "tidyselect"),
requireNamespace, logical(1), quietly = TRUE))) {
d <- data.frame(x = sin(1:80), truth = factor(rep(c("yes", "no", "no", "yes"), 20)))
base <- workflows::workflow() |>
workflows::add_formula(truth ~ x) |>
workflows::add_model(parsnip::logistic_reg(engine = "glm"))
frozen <- calibrate_workflow(generics::fit(base, d[1:40, ]), d[41:80, ], "truth")
print(head(plot(frozen)))
trained <- generics::fit(calibrated_workflow(base, "truth", seed = 42), d)
plot(workflows::extract_fit_engine(trained), which = "width")
}
 #> score lower upper probability width
#> 1 0.0000000 0.0000000 0.5 0.3333333 0.5000000
#> 2 0.4584661 0.3333333 0.5 0.4285714 0.1666667
#> 3 0.4586977 0.3333333 0.5 0.4285714 0.1666667
#> 4 0.4590429 0.3333333 0.5 0.4285714 0.1666667
#> 5 0.4597943 0.3333333 0.5 0.4285714 0.1666667
#> 6 0.4602826 0.3333333 0.5 0.4285714 0.1666667